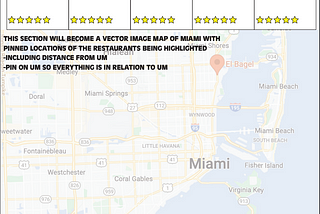
AllegraMy Food Map of MiamiI created an infographic titled “My Food Map of Miami,” which served as my second and final project for the Introduction to Data…4 min read·Apr 30, 2022----
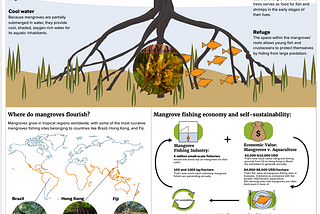
AllegraMangroves’ fish supply as a means of achieving self-sustainabilityThis infographic served as my first project for the Introduction to Data Visualization and Infographics course by Alberto Cairo at the…2 min read·Apr 3, 2022----
AllegrainThe StartupArt Detective: AI for Art Style RecognitionBeing both a computer science student and an artist, I love testing the ways in which I can combine my two interests. In doing so, I…6 min read·Oct 6, 2020--6--6